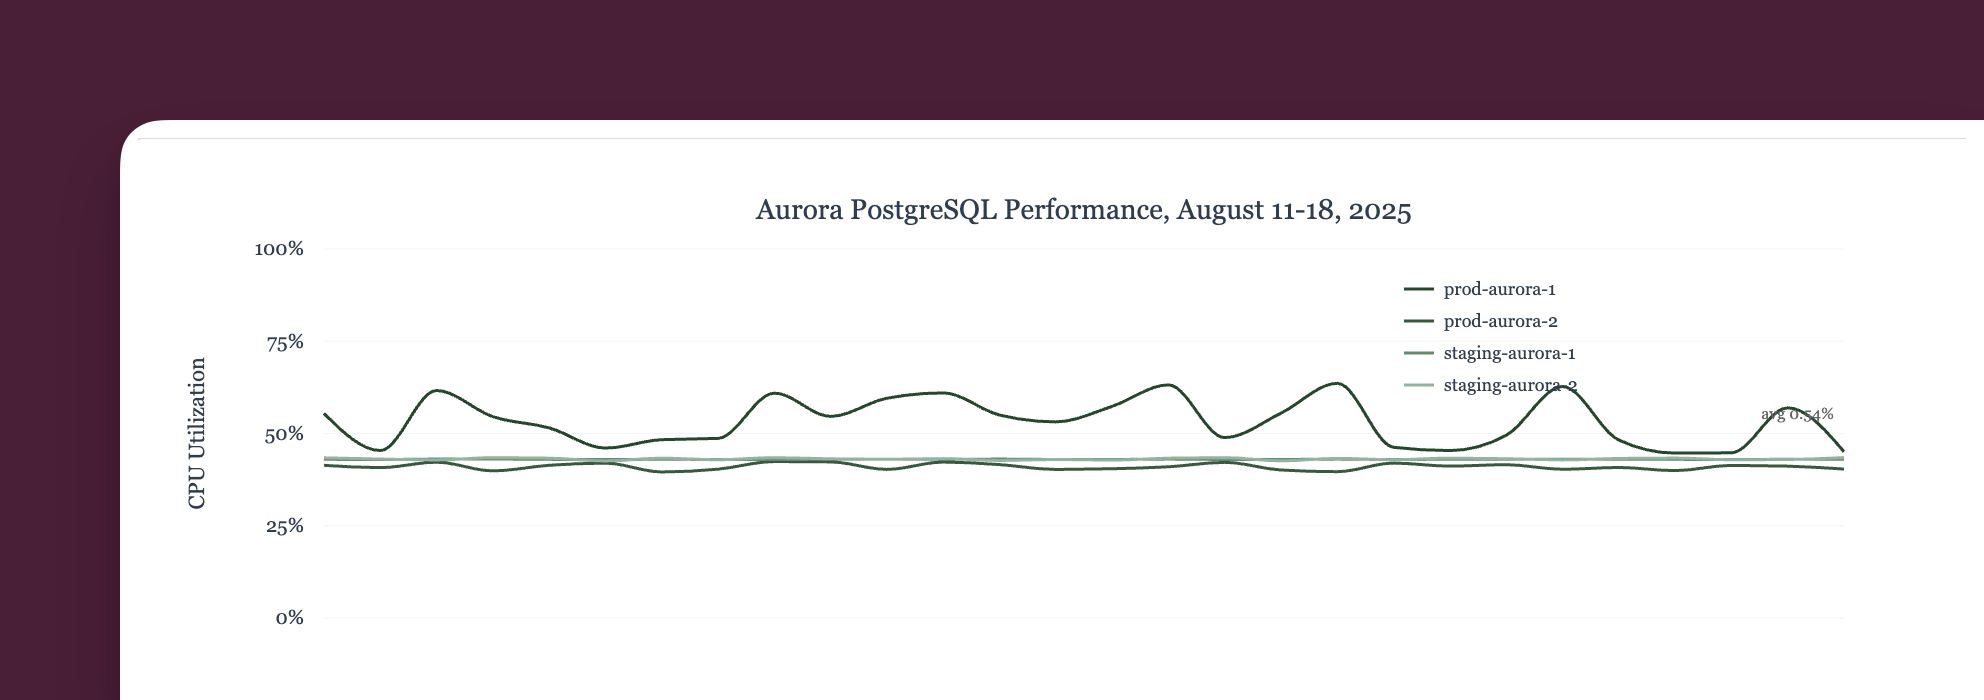
Today we’re shipping natural language graphs in Cased: just ask the agent what you want to see, and it builds the visualization for you.
“Show me why the site is slow.”
That’s all you need to type. The Cased agent finds the relevant metrics, correlates the data, and gives you a useful, practical, actionable graph (and then gets to work on the problem).
I’ve spent years building dashboards that nobody looked at, and the problem was always the same. You need to know exactly what metric to query. You need to know the exact syntax. You need to know which data source has what you want. It’s busy work and a distraction.
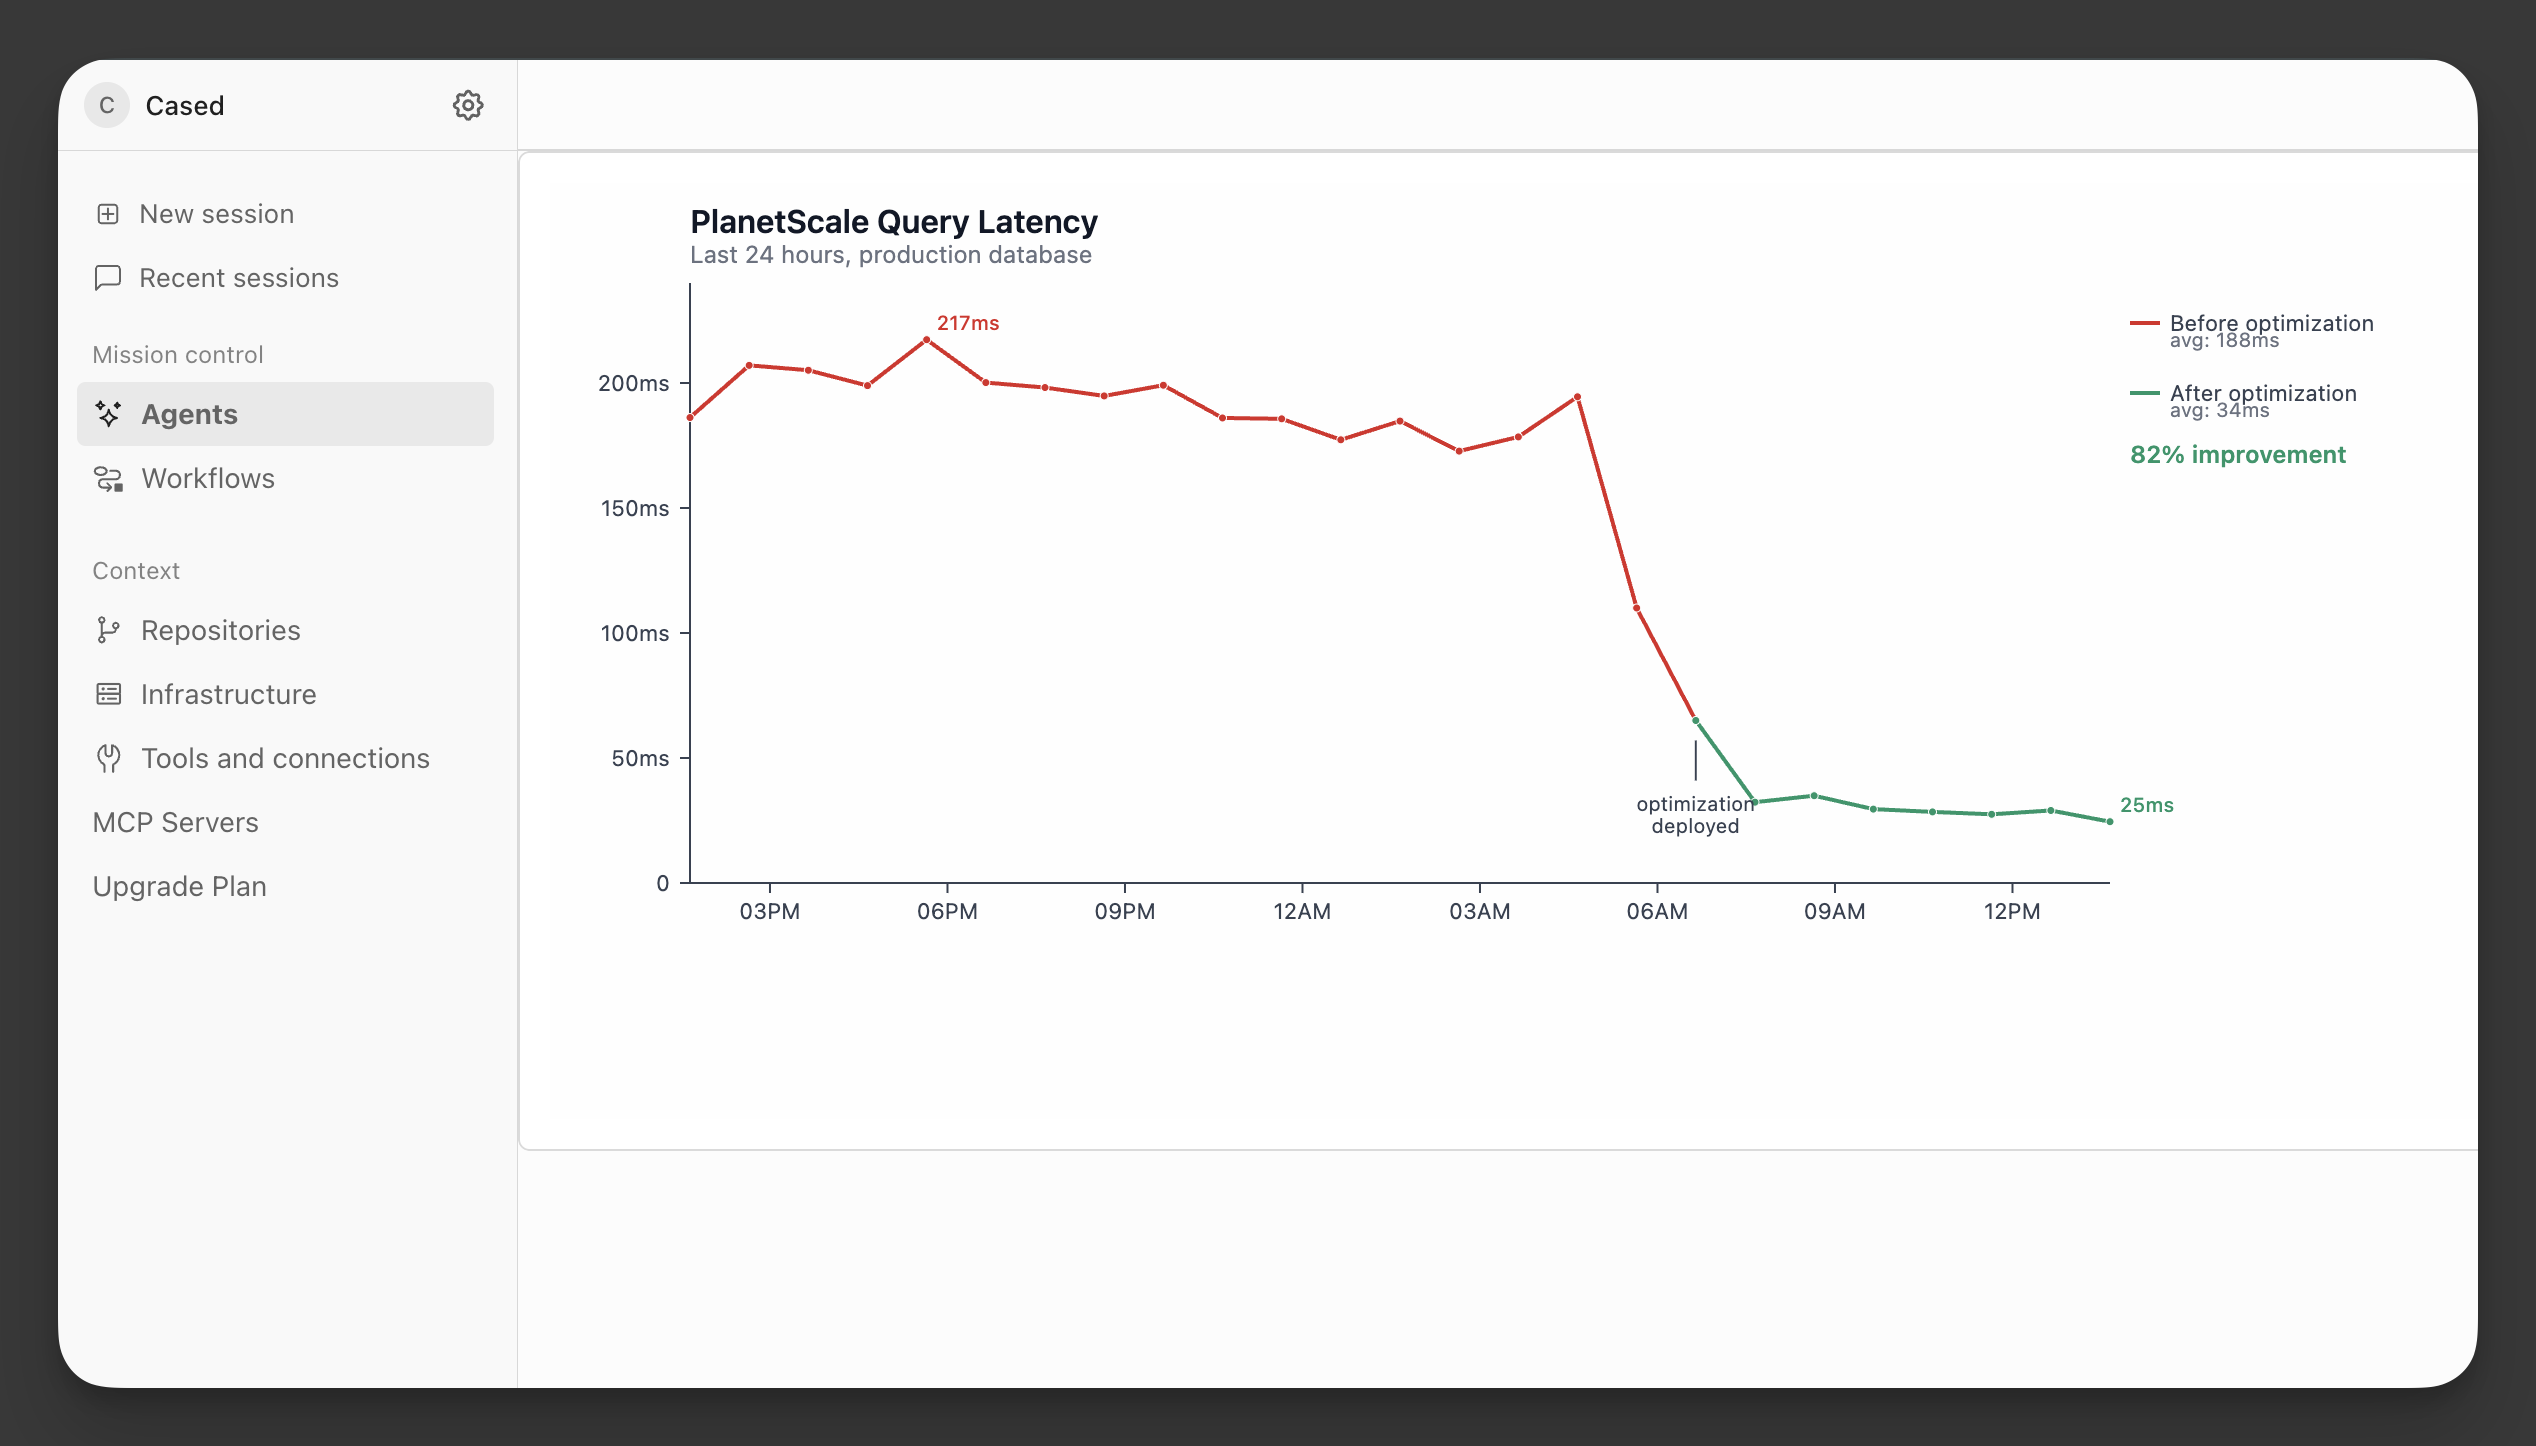 App-level latency drops from 217ms to 25ms (82% improvement) after the Cased agent identified and deployed an optimization at 6 AM.
How It Works
When you ask Cased for a graph, the agent does more than just graph.
First, it identifies all relevant data sources, since you might have metrics in CloudWatch, Datadog, and Prometheus. Cased knows how to query all of them.
Second, Cased understands relationships. If you ask about deployment impact, Cased will think to includes error rates, rollback events, and performance metrics.
Third, Cased generates the visualization, fully customized to your tastes (e.g., I ask for low-key grayscale, high-density because I read Tufte once). Time series for trend, heatmaps for patterns, scatter plots for correlations. You don’t need to specify chart types (although you can).
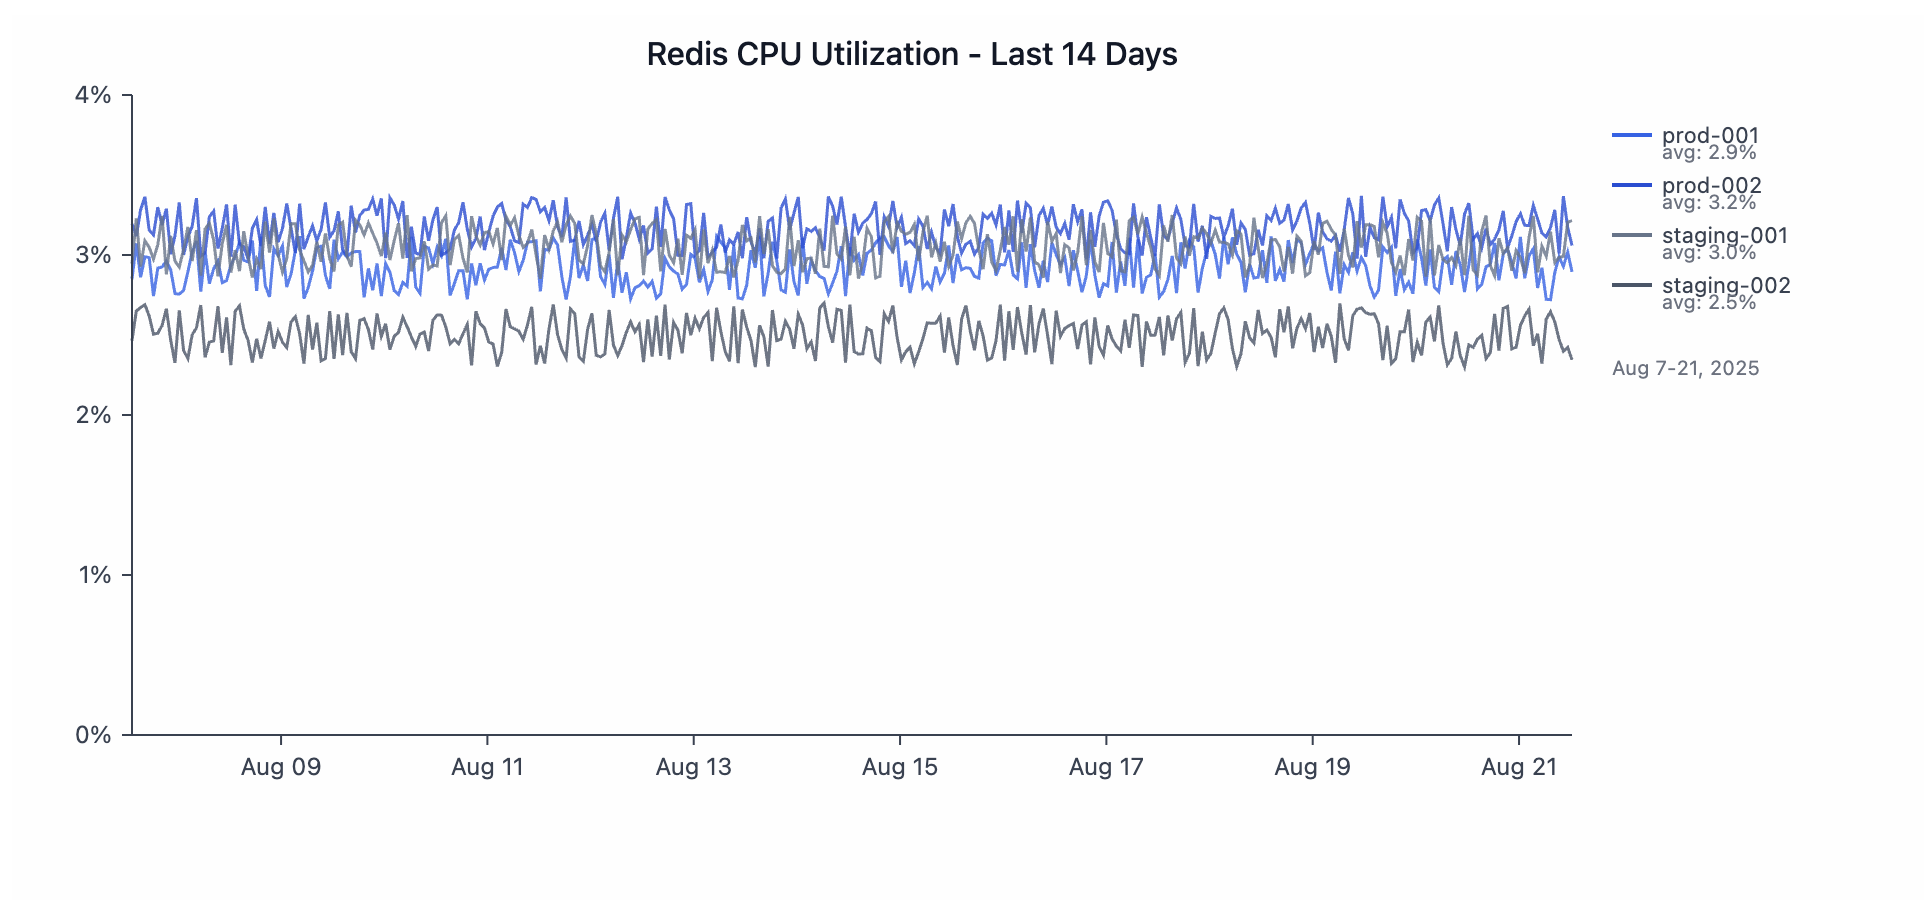 Redis CPU utilization across 14 days showing stable 2-3% usage across both production and staging environments—exactly the kind of boring graph you want to see.
Context That Actually Helps
Traditional monitoring tools are stateless. Every query starts from zero. You have to provide all the context every time.
The Cased agent remembers your conversation. If you’re investigating an issue, each question builds on the last. Start broad, then drill down. The graphs adapt as you explore.
"Show me system health"
"Focus on the API servers"
"What changed in the last hour?"
"Compare with last week at this time"
Each request refines the view. Cased maintains context about what you’re investigating and why.
Natural Language Beats Query Languages
PromQL is powerful, and CloudWatch Insights is comprehensive. But the syntax is a pain, and during an incident at 3am, even moreso.
With Cased, just speak like a human:
“Graph memory usage but ignore the batch jobs”
“Show me 95th percentile latency for logged-in users only”
“What’s different about traffic from Europe today?”
Cased translates intent into queries, and handles the join logic between different systems. It deals with time zones, aggregations, and all the other details that usually trip people up.
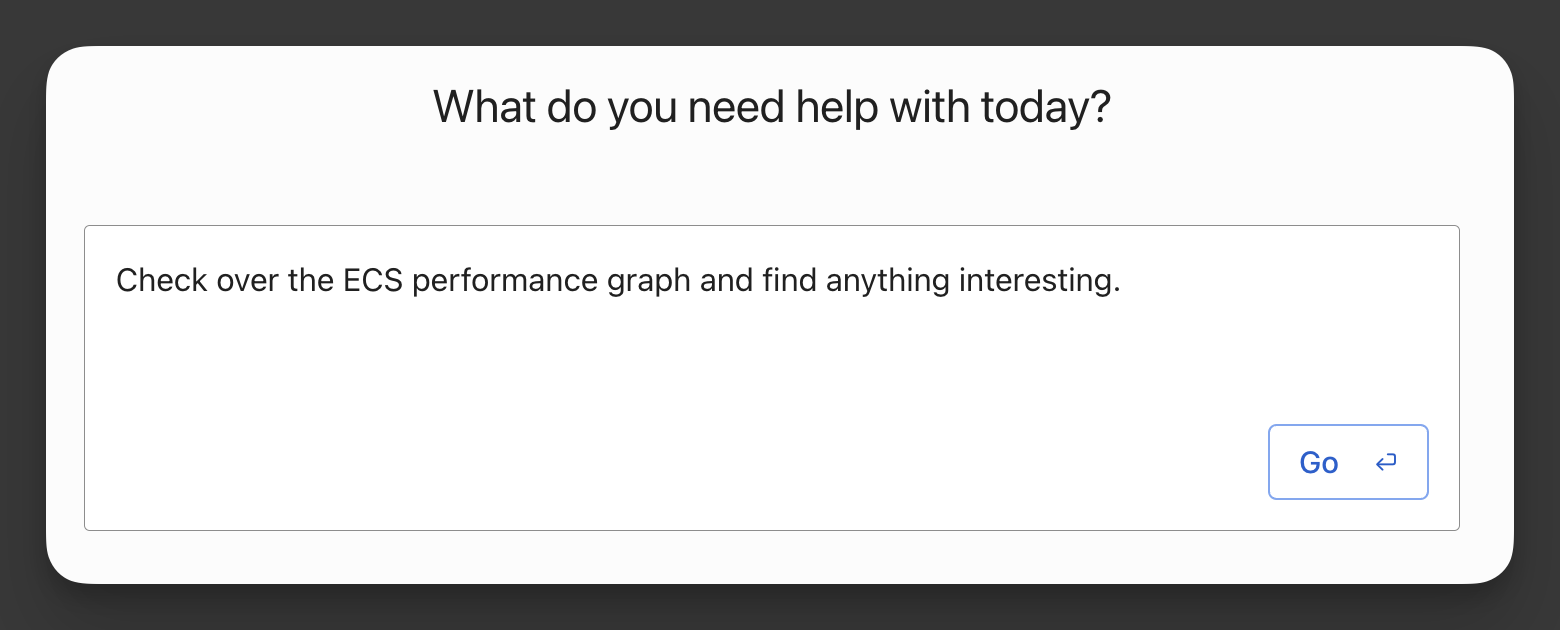 Just type what you want to see. No query languages, no documentation hunting.
Proactive Insights
Additional power comes from Cased’s ability to spot patterns you didn’t ask about.
Say you check error rates, and Cased sees they spike every day at 2 AM. The agent can correlate this with your backup jobs and suggest the connection.
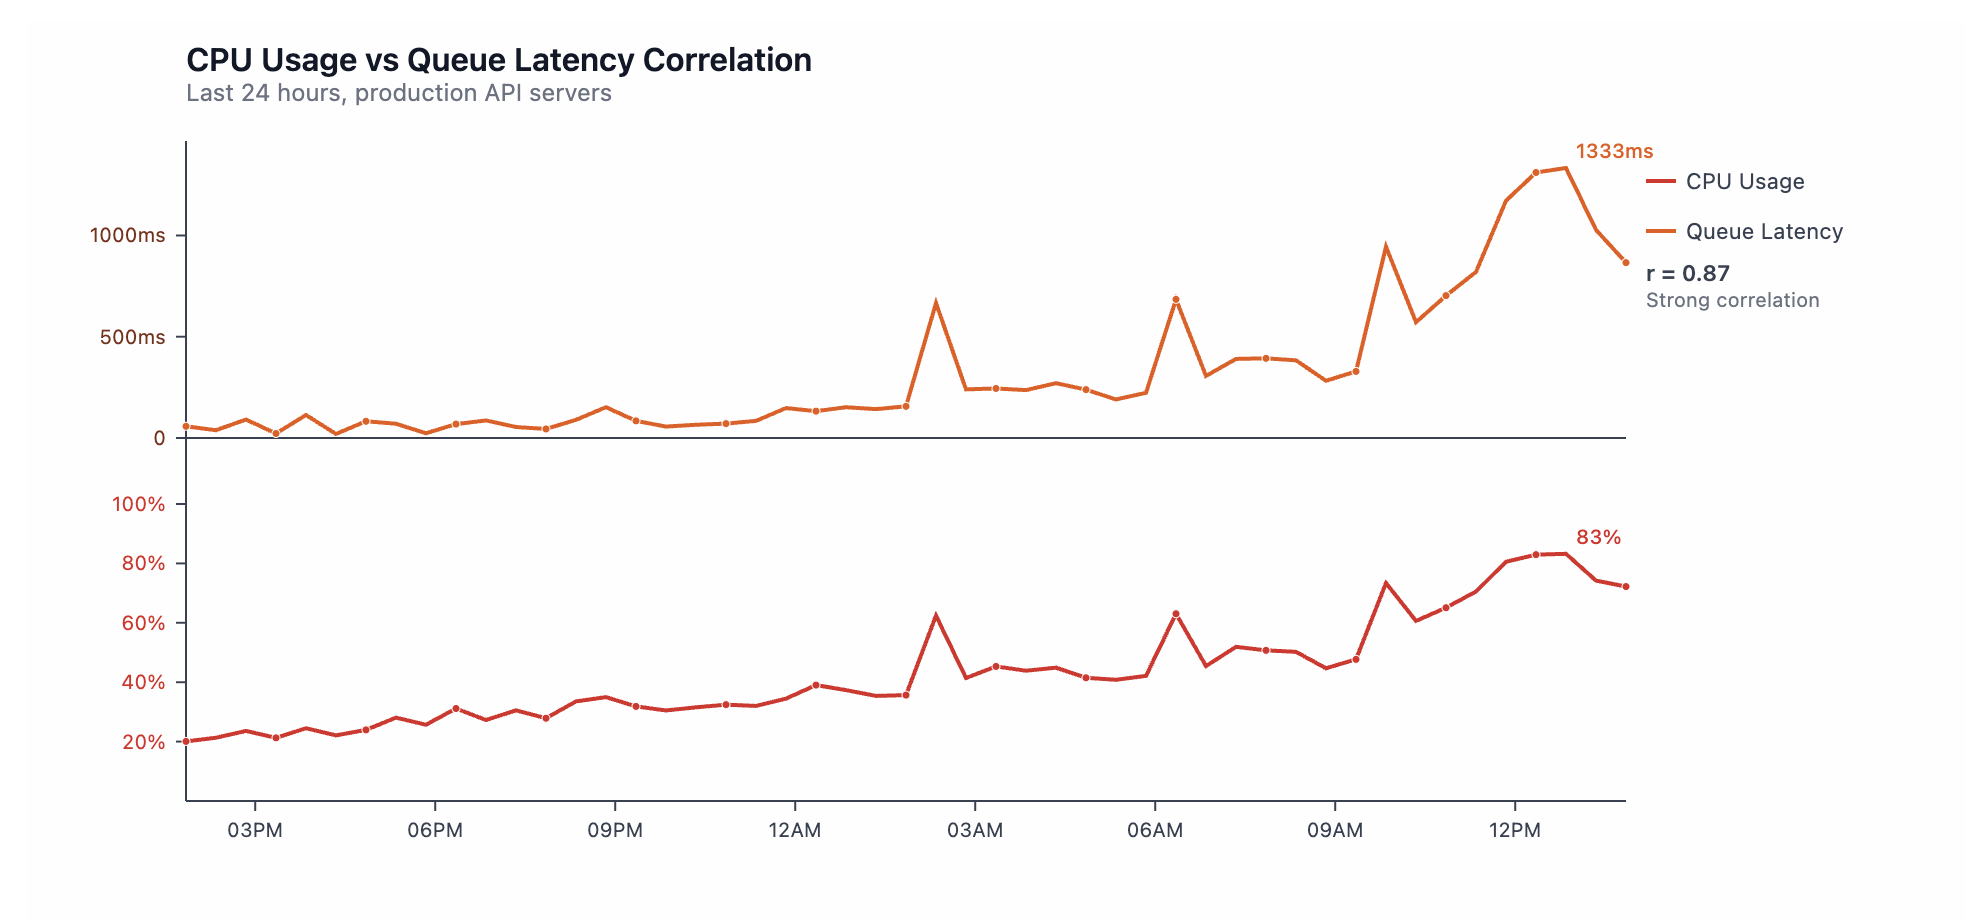 The agent automatically discovers correlations between metrics. Here, CPU usage and queue latency show r=0.87 correlation, revealing the root cause of performance degradation.
From Graphs to Actions
The agent doesn’t just show you data. It helps you fix what you find.
You’re looking at a cost spike. The graph shows unused EC2 instances, and you ask the agent to terminate them. It writes the terraform changes, creates the PR. You review and merge. Problem solved without leaving the conversation.
Memory usage trending up. The agent identifies the service, you drill into the specific pods, and Cased finds the memory leak pattern.
Database connections maxing out. The graph shows the pattern. The agent traces it to a specific microservice. Cased sees the connection pool config in your code and fixes.
Workflows Integration
Cased Workflows chain actions together into straight-forward, repeatable flows. Graphs become part of larger automations.
A deployment happens and a workflow triggers. The agent generates a performance comparison graph. If degradation is detected, it creates an incident. If everything looks good, it posts the all-clear to Slack.
You find a useful cost analysis through the agent. You turn it into a weekly Workflow. Every Monday, your team gets a cost breakdown. Unusual spikes get flagged. The CFO gets a summary.
And many more use cases you’ll come up with.
Living Graphs
Traditional dashboards are frozen in time. You build them once. They slowly become less relevant.
Graphs from the Cased agent evolve, and are built on the fly. So as your infrastructure changes, Cased will adapt: new services appear in cost breakdowns, new endpoints show up in latency graphs. But the natural language query stays the same. You don’t need to manually configure, tag, or change anything.
Start Today
The Cased agent works with your existing metrics. The graphs you need already exist in your data. You just haven’t been able to ask for them properly until now.
