Setting up CloudWatch alarms in the AWS Console is a pain: obscure metric names, unclear threshold numbers (are those bytes, megabytes?), and confusing UX. Then you have to setup SNS topics and subscriptions, and manually repeat this process for every single resource you want to monitor. So we built something better.
Just Say What You Want
Tell the agent: “monitor production RDS CPU usage”.
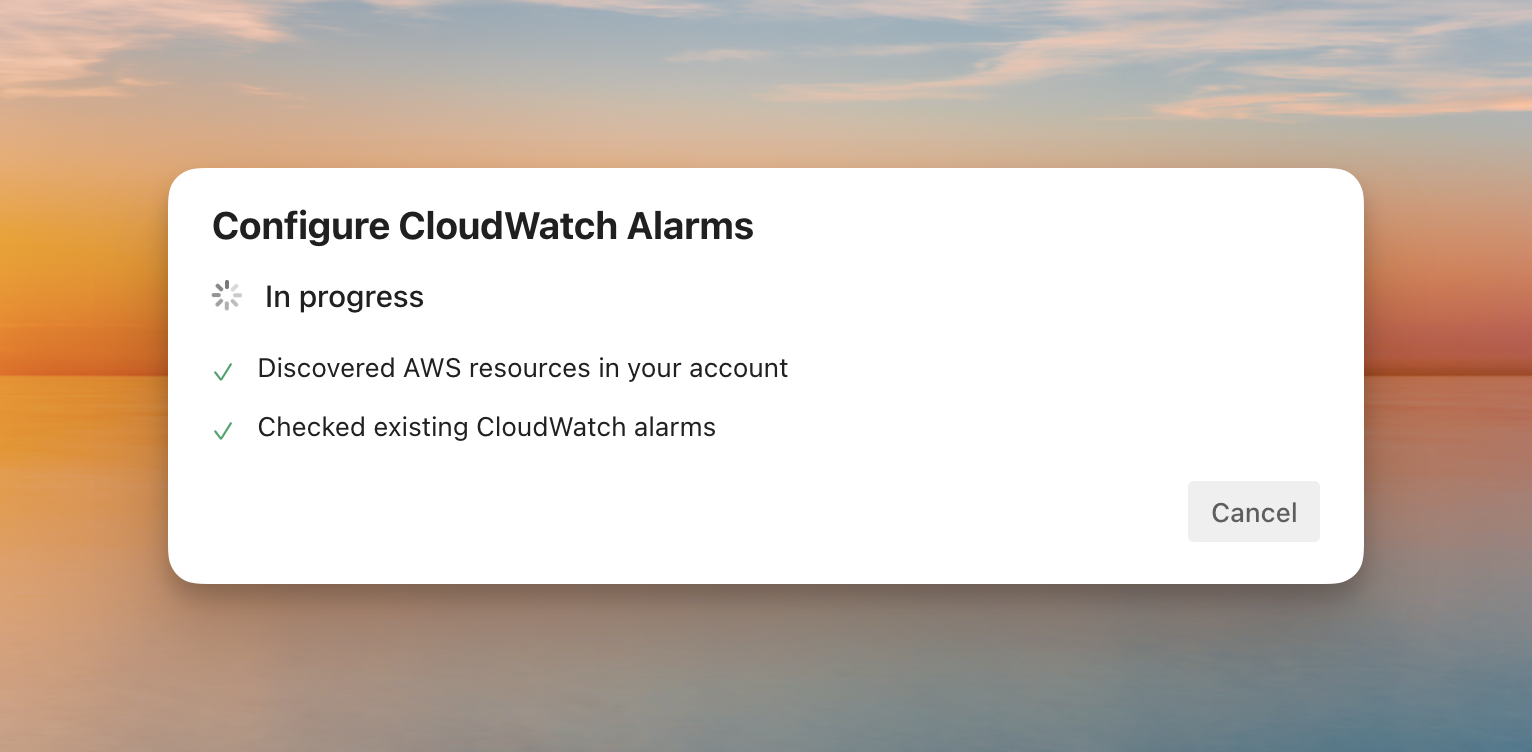
And that’s it. Cased asks a few quick follow-up questions, discovers all your RDS instances, recommends appropriate alarms based on best practices, and creates everything in AWS.
How It Works
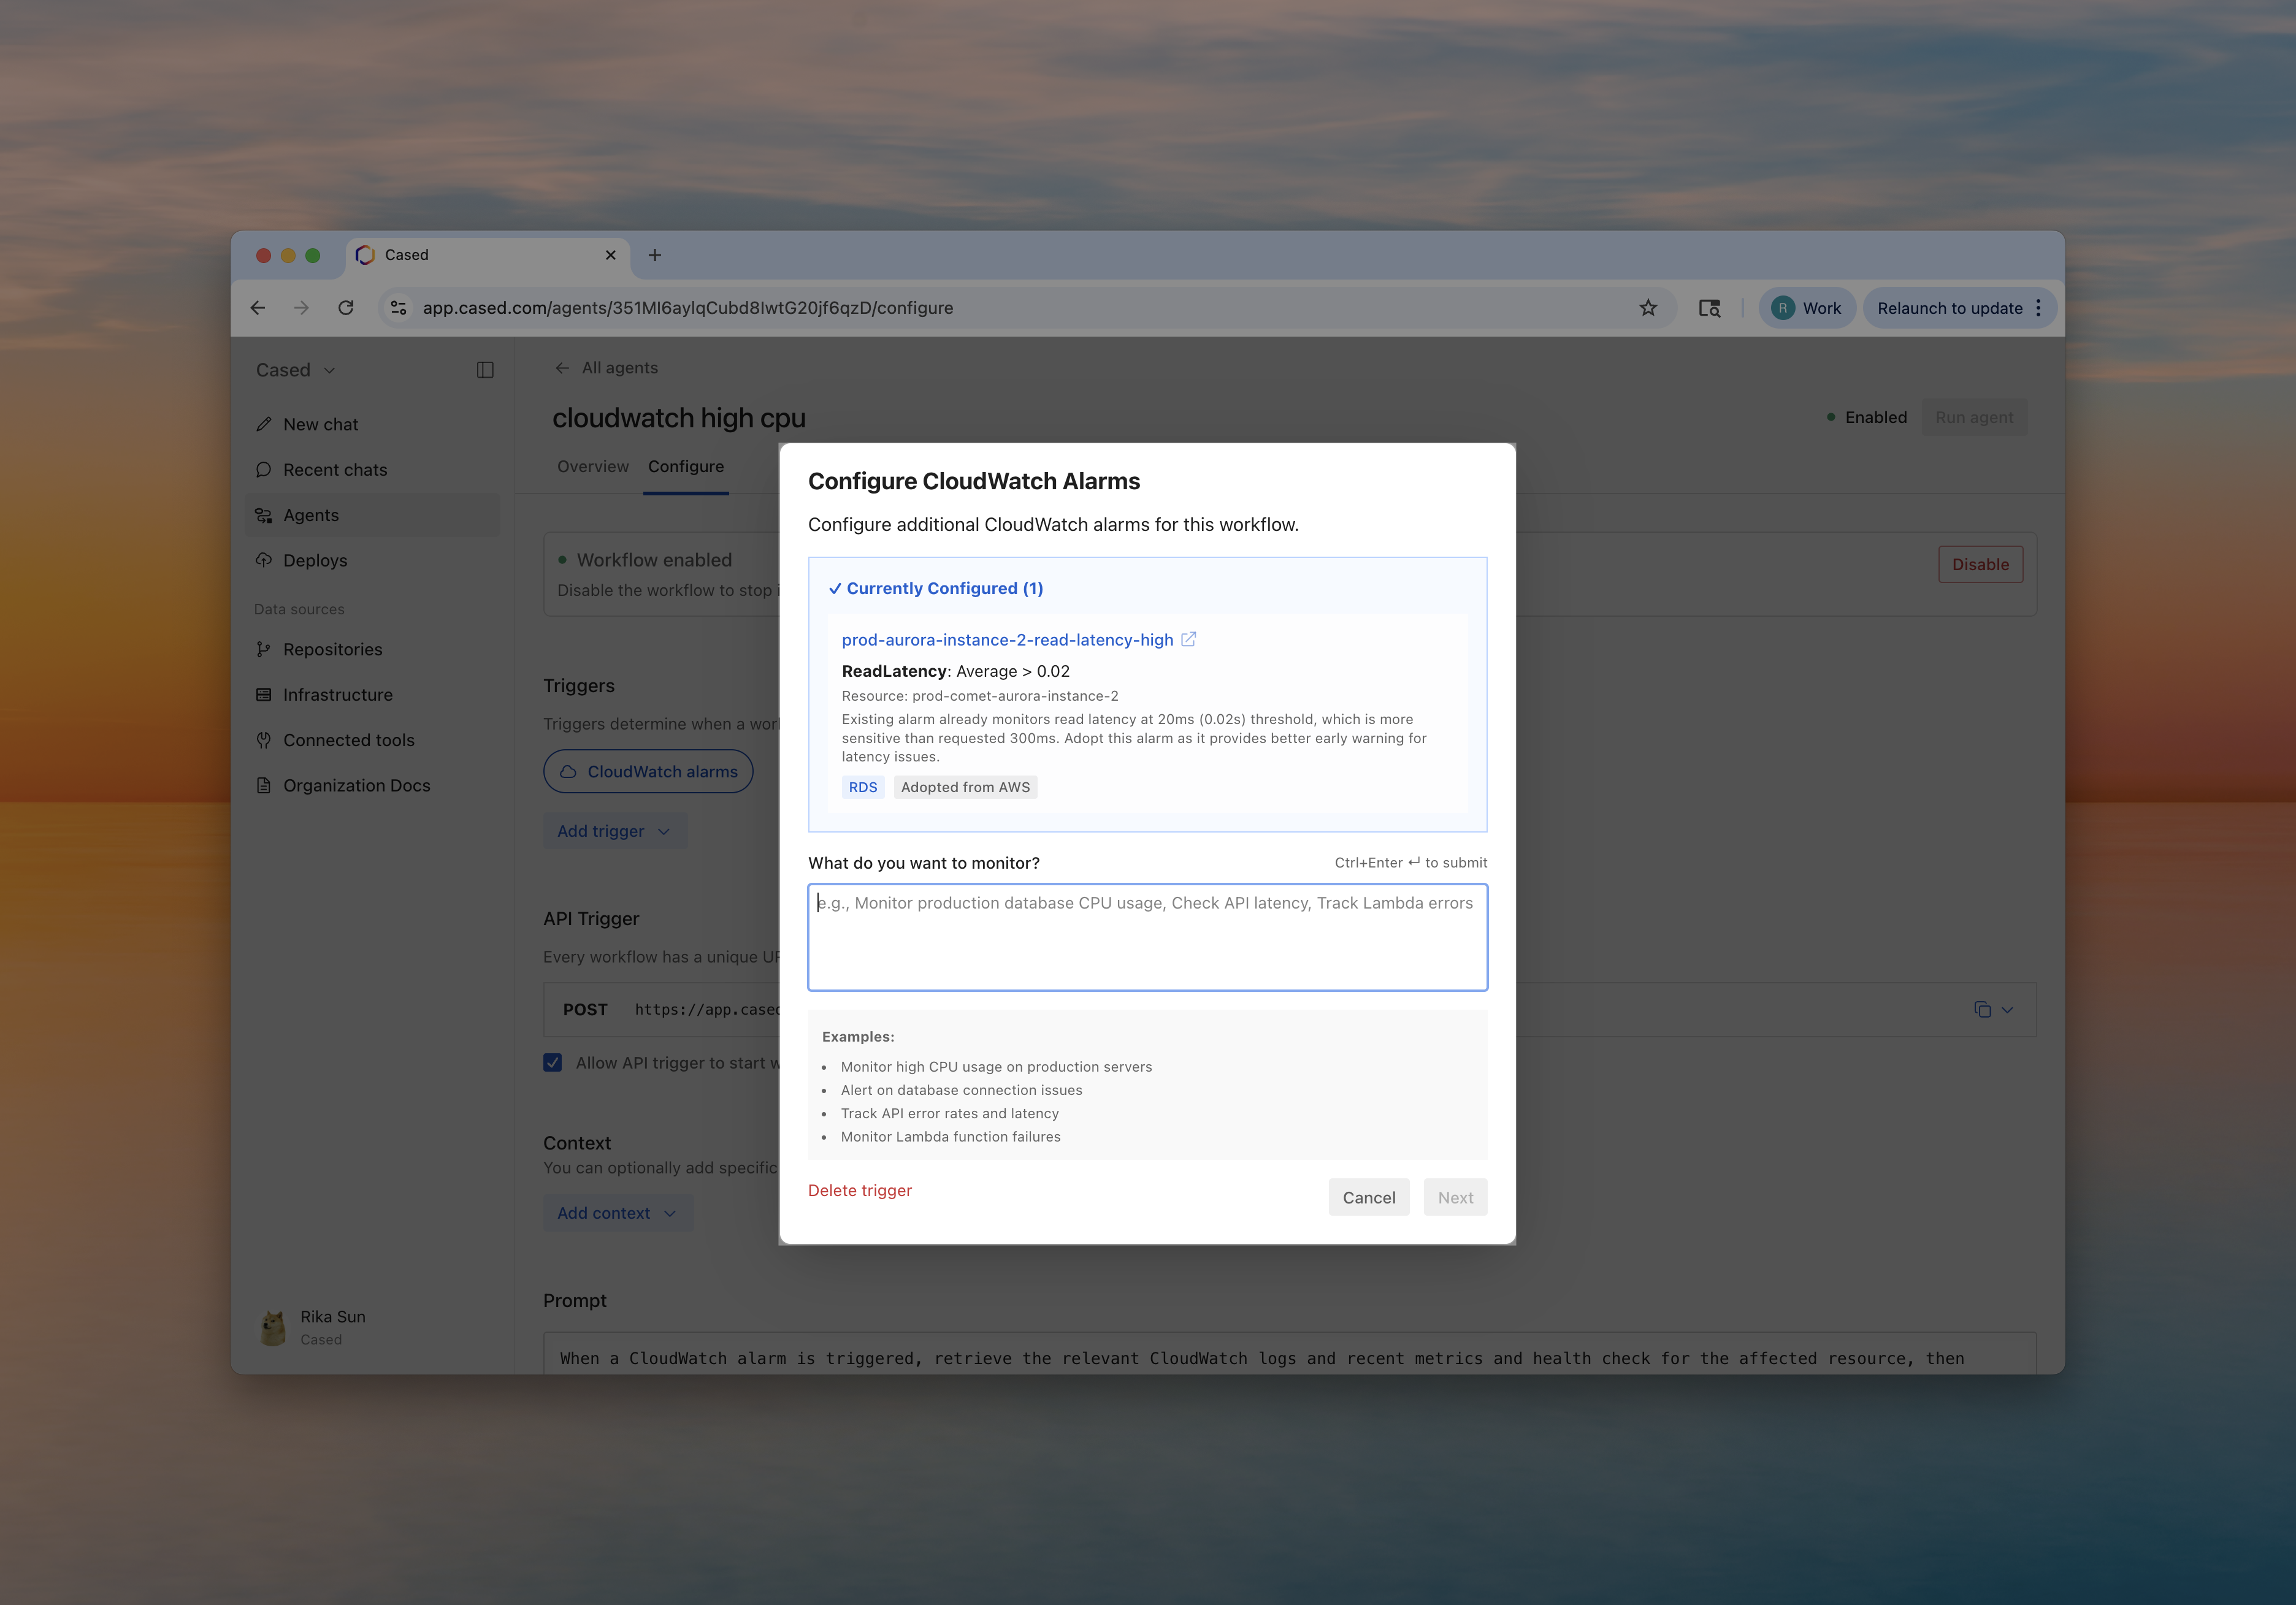
When you create a workflow with a CloudWatch alarm trigger in Cased:
- Describe what to monitor - “Monitor production RDS CPU”
- Answer follow-up questions (max 3) - Cased can mostly figure it out from there, but will ask for more if tf needs to.
- Pick recommended alarms - Best practice thresholds and evaluation periods suggested
- Confirm - Everything gets created in AWS with SNS configuration
The whole setup takes under a minute. One conversation sets up monitoring across all your resources. In the AWS Console, you’d repeat this process manually for each instance.
From Alarms to Action
Traditional CloudWatch alarms just send an email, and it joins 47 other “critical” alerts in your backlog.
With Cased, alarms trigger workflows that actually investigate and respond. Here are realistic workflow prompts teams use:
Database Performance Investigation
When the RDS CPU alarm fires:
1. Pull current database metrics (CPU, connections, memory)
2. Check for slow queries in the last 15 minutes
3. Look for recent deployments that might have caused the spike
4. Analyze connection pool configurations in application code
5. Post summary to #infrastructure-alerts with recommendations
ALB Health Check
When ALB 5xx errors spike:
1. Identify which target instances are returning errors
2. Check ECS task health and resource utilization
3. Review recent deployments to the affected service
4. Examine application logs for the error pattern
5. Post incident summary to Slack with next steps
Auto-Scaling Response
When EC2 CPU exceeds 80%:
1. Check what processes are consuming CPU
2. Verify auto-scaling is working correctly
3. Compare current load to historical baselines
4. Check if this correlates with a recent deployment
5. Recommend scaling action or code optimization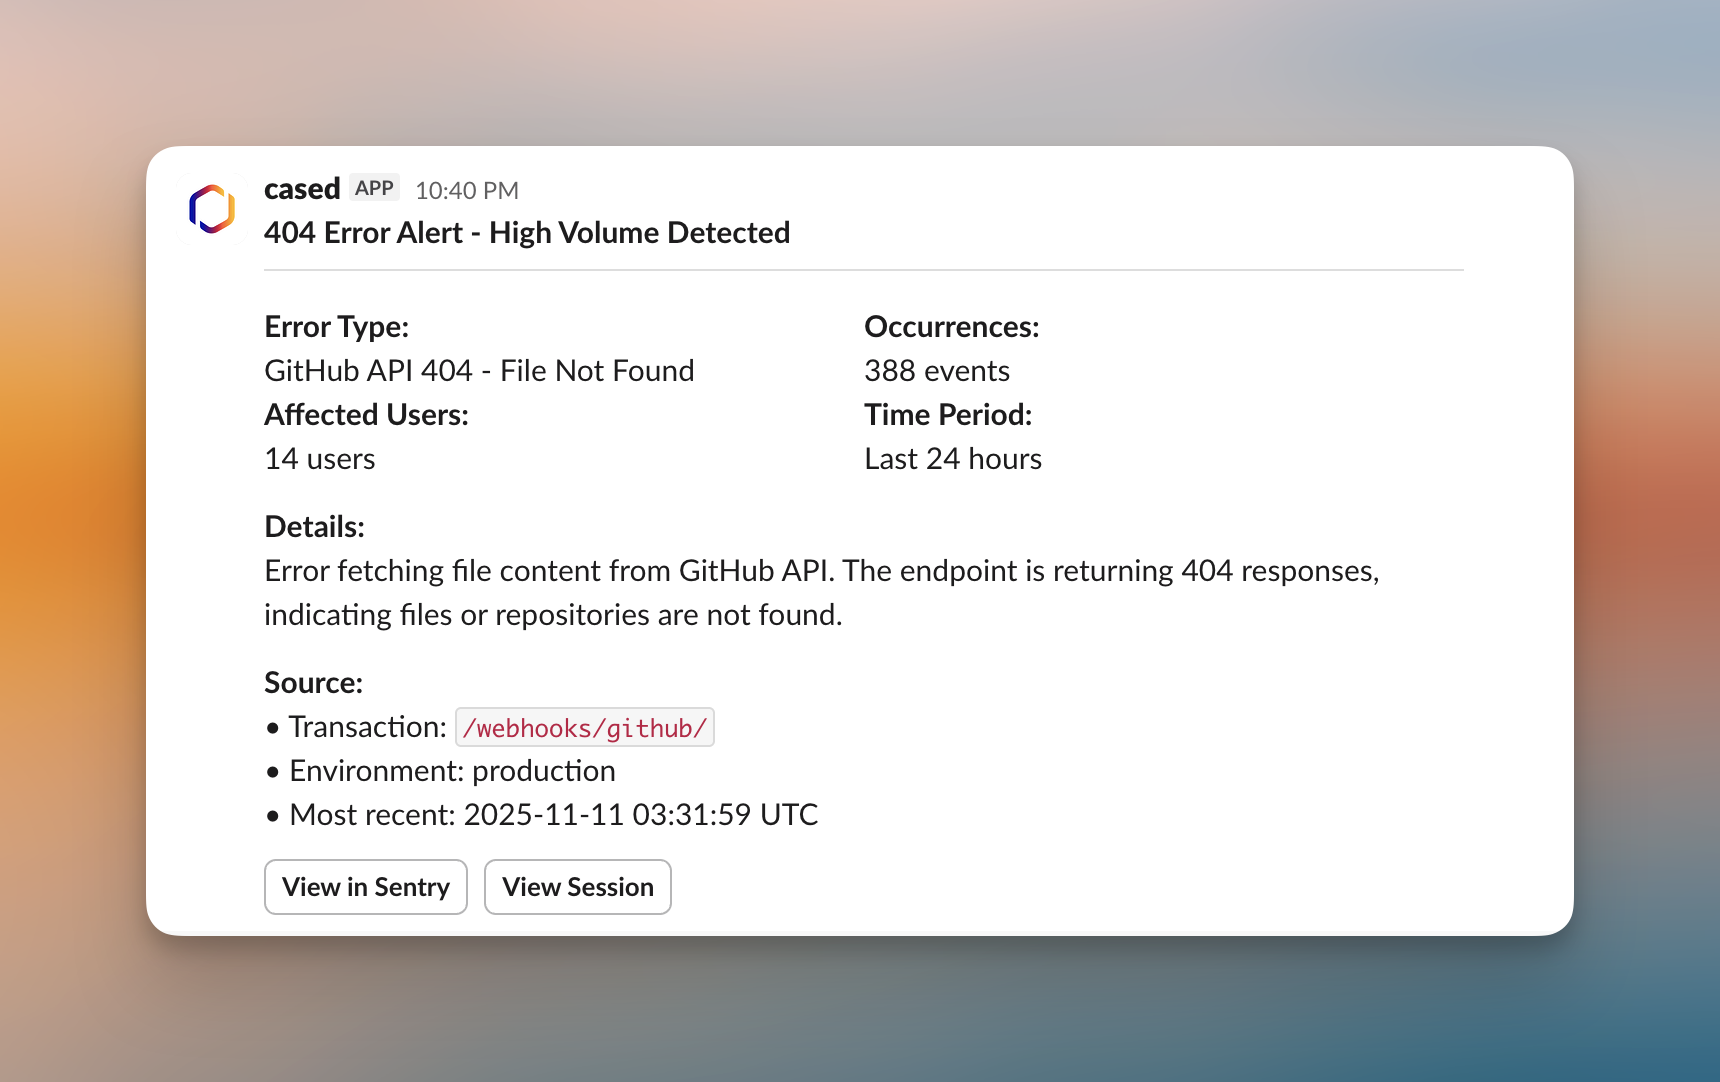 Real production alarms monitoring ALB 404 errors. Cased creates the alarms in CloudWatch and triggers workflows when they fire.
